[R-bloggers] Arnaub Chatterjee discusses artificial intelligence (AI) and machine learning (ML) in healthcare. (and 7 more aRticles)
[R-bloggers] Arnaub Chatterjee discusses artificial intelligence (AI) and machine learning (ML) in healthcare. (and 7 more aRticles) |  |
- Arnaub Chatterjee discusses artificial intelligence (AI) and machine learning (ML) in healthcare.
- Bootstrap Testing with MCHT
- Data Science With R Course Series – Week 7
- About a Curious Feature and Interpretation of Linear Regressions
- crfsuite for natural language processing
- RStudio IDE Custom Theme Support
- Reproducible Finance, the book! And a discount for our readers
- Is the answer to everything Gaussian?
| Arnaub Chatterjee discusses artificial intelligence (AI) and machine learning (ML) in healthcare. Posted: 29 Oct 2018 09:00 AM PDT (This article was first published on DataCamp Community - r programming, and kindly contributed to R-bloggers)  Hugo Bowne-Anderson, the host of DataFramed, the DataCamp podcast, recently interviewed Arnaub Chatterjee, Senior Expert and Associate Partner in the Pharmaceutical and Medical Products group at McKinsey & Company. Here is the podcast link. Introducing Arnaub ChatterjeeHugo: Arnaub, I'm really excited to have you here today to talk about the role of AI, data science, and machine learning in health care, what has and hasn't worked, but before we get there, I'd love for you to set the scene of your own journey and let us know how you got into data science originally. Arnaub: Thank, Hugo, and thanks to DataCamp for having me today. The notion of how I got into data science is quite serendipitous, and as is a lot of things in life, a bit of the right time in the right place. I think there's also a concurrent movement within health care where data science is really taken off within the last 10 years, so as a lot of perfect storms work, all these factors aligned. I think my career's been a little bit of a zig-zag in terms of the fact that I've held roles in consulting, worked for the previous administration in both of the technology and the policy worlds, and then in pharma, and now back in consulting. The central theme or ethos around how I've worked has always been around data science and the common thread and some link to data science. Arnaub: Just to give you the quick background, I started my career after grad school as a consultant, originally focusing on pharma MNA, but then helping AIDS filled health data infrastructure in a pre-ACA time, Affordable Care Act time. That actually led me to go work for the Obama administration. I transitioned over to initially work on some data science efforts around health care fraud and abuse, and thinking not only about the policy, but also around how do we think about the utilization of that data, and to predict who may be more likely to commit fraud and fraud the government. Arnaub: Things transitioned into more of a technology bench from that perspective. I then had the opportunity to work with a few technology officers within HHS, and at the time Todd Park and Bryan Sivak were creating a new movement around open data and building APIs and platforms that access this tremendous amount of data the government sat on, so very, very fortunate to have run into two Silicon Valley guys who brought their DNA over to government and start a number of initiatives like the Health Data Initiative. We're building platforms around fda.gov, clinicaltrials.gov, open APIs. A lot of that was also very right time and the right place, and being able to learn from folks who'd done it in the private sector with a technology mindset. Then the pharma aspect of it, I actually ended up transitioning over to pharma because of government, and followed some folks up who had spent some time working in government and started a team that was focused on data science at Merck. What we were doing at Merck was very much around how do we utilize and identify novel data sets, which could include rogue data-like claims, but it could also include clinical and genomic and social media and censors. It really utilized and think about how we demonstrate the clinical and economic value of Merck products. This was a whole new way of thinking about positioning the drug in a different way and thinking about the advent of new methodologies within data science to support and bolster the value of the drug. Arnaub: I did that for a number of years and worked with a variety of academic institutions on different machine learning methodologies, different data science methods. All that eventually led me to McKinsey, where I am right now. In that capacity, I do a lot of work with not only pharma clients but technology clients and how they're entering the health care sector. I feel in that capacity I've been fortunate to be at the front lines of how different companies are deploying machine learning, data science in a variety of different settings. Hopefully we'll cover a lot of that today. Hugo: Absolutely. And as you say, it took a lot of moving parts, or it's almost a perfect storm of your interests and serendipity of technology and the emerging data science stack and all the data available that made this career path for you what it's become. We'll see that that happened in this space as well. That is actually took a lot of moving parts, availability, and generation of large scale data, computational power, statistical insights, that allowed data science, in health and otherwise, to emerge as it has. How did you learn your data skills?Hugo: I'm also interested in the fact that you started thinking about this type of stuff at grad school, and that's when you started working with data. The skills you needed then and need now to work with data, are these skills that you learned on the job, or were you trained specifically to do this type of work? Arnaub: It's an interesting question. I think in grad school I spent some time in biostatistics and epidemiology. My background's in health care on the business side and then also health policy bent. The funny thing about data science is if you ask a lot of folks in healthcare they'll tell you that a data scientist is a statistician in California, and they'll basically say that that notion and term has changed a lot as methods and the advent of machine learning has really warped what that definition means. Arnaub: In some capacity I think people who have worked with traditional claims data and have skill sets like epidemiology, like biostatistics, are in their own right data scientists. I think what's changed now is, like you mentioned, greater volumes and different types of data. There are different ways of processing and understanding how we use it. My training started there, and then now I think, like a lot of people, I'm having to evolve and learn just based on the fact that a lot of disciplines are converging. Computer scientists and the fact that there are actually data science degrees now, programs that are teaching different ways of using data, those are converging with a lot of old school ways that people have used health care data. That's where I find myself right now. Hugo: Great, and I love that you mentioned different types of data because I suppose heterogeneity of data is something which is so abundant, and actually, when people ask me where does this occur, the clinical setting is one that I mention initially that you can have tabular data from experiments and controls in addition to imaging data from scans, which we'll get to, in addition to natural language from doctors' notes on patients files and that types of stuff. AI in HealthcareHugo: I think that's a great time to move into this conversation about the use of AI in health care. As we know, there's a great deal of hype around the use of machine learning in AI and health care. I'm wondering from your point of view, what has actually worked in this space? Arnaub: Yeah, it's a really important question, and I think when we talk about what's actually worked, I think it's important to know that this is a very much evolving space, so in some cases the jury is still out. In other cases, we're starting to see very promising signs. Just to acknowledge the hype, I guess in my personal opinion, we're in a golden era of funding for AI in health care. I think the statistic that I saw more recently was that since 2016, there have been 300 startups in AI in health care alone that have emerged. These companies span the gamut from reducing administrative scut work within insurance and billing companies, to actually creating new drugs and empowering compound development. I think what's important about that is we're starting to now see where a lot of the attention for AI is being driven towards and where the media attention is going towards. Venture dollars are flowing to companies that are also streamlining a lot of operational and efficiency tasks, administrative efficiency tasks in health care. They're also flowing towards companies that have these bold aspirations of upending processes that have been happening for decades now. Arnaub: What we're trying to discern is what a successful outcome looks like, and how do we think about what the bigger aspiration is, where do we see tangible improvements in health care, how do we think about the advancement of patient outcomes? This conversation, it's not meant to splash cold water or put a wet blanket on the great work that's being done. It's just meant to try and understand, like you mentioned at the very beginning of the conversation, a lot of talk about this has been taken place to where we've seen the promise. Arnaub: Let me go ahead and take on a few different examples in spaces where I think this has worked, and we can have a deeper conversation about this. The very first things you mentioned was around imaging, and particularly within diagnostic imaging and health care, that's a bedrock. I think it's really important to remember that pioneering use cases of AI in other industries actually started with the ability to read back pictures and look at faces and patterns and objects in photographs. That is very much similar in health care where a lot of our lighthouse use cases where we've seen great success are starting to take place. Arnaub: To give you a little bit of a context on the growth of this market, AI facilitated diagnostic imaging is supposed to be a two billion dollar industry by 2023. That is just a fraction of the whole medical imaging market, which is 57 billion dollars. 57 billions dollars includes equipment, it includes software, services, so it's a massive, massive marketplace that has been in health care for quite some time. I think what we're seeing now is a consensus from a number of parties, whether it's hospitals and technology companies, is that AI is going to transform the diagnostic imaging industry, whether it's enhanced productivity, whether it's improved accuracy, personalized treatment planning, all of these functions are up for grabs. Arnaub: Just to build a little bit more on this, why imaging as sort of the first place we're seeing improvement, for one thing, hospitals are producing around 50 petabytes of data per year, and 90% of that data is from medical imaging. We're talking about MRI scans, PET scans, CT scans, and all of these are also embedded within EHRs. I think that's one reason, is the availability and the ubiquity of this data. Arnaub: I think the second reason is that there are a number of compelling use cases that are actually there now within health care. To pick on some great work that Google has done, Google Brain has published their really powerful paper within JAMA, where they worked with a 130 thousand patients from an eye institute, and they looked at retinal fundus images. What they were able to do was come up with a more sophisticated, convolutional neural network that was able to predict diabetic retinopathy, which is one of the leading causes of blindness globally. Around 400 million people have this disorder. Arnaub: What they effectively did was come up with a more refined version using a subset of those 130,000 images, and they outperformed a panel of eight ophthalmologists in terms of understanding where the retinopathy took place and how do you actually characterize what are the contextual clues. Their F-score was .95. The fact that they had an adjusted AUC, the fact that it was in JAMA. There's quite a strong, clinical argument to be made that if we get access to more of this type of data and we're able to build it into different tools and processes and how ophthalmologists see their patients, that's just the beginning, I think. Deep Mind has a very similar study within the retinal space. Just those two examples alone, I think, are pretty compelling. Not only are you seeing this in ophthalmology, but you're also starting to see it within dermatology and pathology as your next set of lighthouse use cases. What types of companies are making the advancements?Hugo: It strikes me as interesting, and I'm wondering if it's interesting to you, that it's companies such as Google in this case, that aren't traditionally known in the health care space that are making such advancements. Arnaub: Yeah, I think you're starting to see a lot of interesting collaborations between companies that have world class machine learning and health care institutions. On the other side of Silicon Valley you have Facebook. Facebook just announced their collaboration with the NYU School of Medicine, where they're utilizing their AI to speed up recognition of MRI scans. The projects for those of you who are interested is called Fast MRI. It's looking initially at around three million images of the knee and the brain and the liver, and looking at around 10 thousand different patient cases. That was just recently announced. We'll see what the fruits of that labor are. Arnaub: I don't think it's all that surprising. I think the computational power, it's now incumbent upon Google to figure out how do they think about where the applications are, where the use cases are, and I think this is where you're starting to see imaging as that first initial lighthouse for them because they can, compellingly … they have done this in other industries, and now they're compellingly able to do it with health care data as well. Use Cases for AI in HealthcareHugo: So you were about to go and tell us a bit more about use cases in ophthalmology and dermatology, for example. Arnaub: Yeah. I think we're starting to see similar … ophthalmology's obviously the retinal disease example. We've started to see different cases with breast cancer. There is a great example of a partnership between Kaggle and Intel and a company called MobileODT, where they developed an algorithm that accurately identified a woman's cervix and how do we better screen and treat woman for cervical cancer. The data was consisting of around 10 thousand label cervix images, and it had type one, two and three cervical cancer. This was a 50 layer convolutional, neural network, deep learning model that accurately segmented different parts of cervix type identification. Just another example where this algorithm, just by leveraging the power of the crowd, it wasn't even academically trained or clinically trained folks, they are able to capture and accurately identify cervix type 75% of the time. Arnaub: I think something to notice that's really important is that these CNNs are actually reproducible. You don't have to rebuild and reinvent to wheel every single time. I think that's where you're going to start to see great refinement, and you're going to start to see a lot of enhancement in terms of how we do imaging recognition and reproducing these algorithms. Arnaub: I think the second thing is these major partnerships where you're starting to see tech companies partner with eye institutes and large corporations that have imaging data. That's going to be very compelling and powerful. Hugo: And so when you say reproducible, do you also mean reusable in the transfer learning sense? Arnaub: Yeah, I think we'll get to this, I think, later on, hopefully, but one of the big challenges with AI is just making it reproducible within health care. The big hurdle there is that data is different in many different parts of the health care system. The patient that you're seeing California will be very different than the one that you're seeing in Texas or South Carolina or Boston. I think what we're trying to better understand is how do you create a generalize-ability on an algorithm that may have been used within a certain subsection of the US population or the global population. Then being able to consistently come up with those algorithms is what is a challenge because there are also different ways of characterizing this, and I'll spend some time talking about this later. Arnaub: For radiology specifically, the outcomes that you're looking for are different. You might look at the probability of a lesion, and you might look at the feature of a tumor. You might look at the location of a tumor. You have to consistently do that exercise with different types of imaging data over and over again in order to day the algorithm is reproducible. I think that's where we're starting to see that we have to continuously be able to prove that this algorithm is accurate and identifiable with other data settings. Other ExamplesHugo: Look, in all honesty, having this conversation makes me realize even more how important it is to de-mystify these things, particularly because there are so many touch points, right, of where AI can have an impact in health, as you've mentioned, everything from administrative tasks to the scut work, the insurance industry, to all of these diagnostics. Before we move on, I'm wondering if there are any other examples or super interesting use cases to your mind? Arnaub: Yeah. Absolutely. The second, I think, bedrock, lighthouse that we're seeing a lot of is around diagnosis prediction. How do you think about new variables that you haven't unearthed within data that might contribute to the progression of treatment. Arnaub: We're actually working with several clients in this space right now on coming up with novel prognostic variables that could lead to the progression of a disease, perhaps predicting earlier onset of the disease. I think what makes this compelling is there's still a great amount of misunderstanding, there's still a great amount of unmet needs that we're not characterizing within our patient population. If we're able to better understand using machine learning methods on who those patients might be, we might be able to do incredible things in how we're getting them in and out of the hospital, seeing a provider quicker. Arnaub: A great example of this is: Emory just released a study on sepsis where they looked at 42 thousand patients, and they looked at 65 different measure that might be predictive on the onset of sepsis. They looked at within different time intervals, so within four, six, eight, and 12 hours. What was cool about this is that they were able to come up with the same model and the same level of accuracy as a physician in predicting sepsis with a validation cohort between the doctor and the tool that the algorithm was basically indistinguishable. This is an example of not machine versus physician. It was more that we have the ability to not only confirm and corroborate what physicians are finding. If we continuously refine this, we might find more measures that are more predictive on sepsis. Arnaub: The one other example I want to share with you actually just came out last week, and this was in the Journal of the American Medical Association, a pretty top tier publication. This was looking at a randomized trial of 500 and some patients with staph infections. They looked at patients over a six year period, and they found that an algorithm did just as well as doctors in suggesting how to treat them with antibiotics. What makes this really compelling is that they were able to say that patients who were on certain antibiotic protocols were on a drug for a certain number of days. They might have been on a certain number of drugs for a fewer number of days. You basically are looking at how we can think about antibiotic protocols and what is the best practice for keeping patients in and out of the hospital. I think that's where you're starting to see a lot of compelling evidence, and given that this is now appearing in top tier medical journals, it's not something that's in the future. These are things that are happening right now. Hugo: And something you've hinted at several times already is that we're not necessarily … there's a false dichotomy between humans and machines, essentially, right? Arnaub: Yeah. Future of AI in Health CareHugo: And what is more interesting, I think, is the idea of human algorithmic interaction. The idea of having artificial intelligence and machine learning models with humans in the loop. Do you see this being part of the future of AI in health care? Arnaub: I guess this is your robots versus physicians conversation? Hugo: Sure. Arnaub: Yeah, I think there are a few … I'll give you two funny anecdotes that are perpetuating this theory of whether we … We hear a lot of statements around whether physicians are going to be replaced by doctors. One example is medical students are actually reportedly not specializing in radiology because they fear that the job market won't even exist anymore within 10 years. Arnaub: The other examples is there's a really interesting company in China called IFLYTEK, that is a pretty substantial Chinese AI company. It was the first machine to pass a medical exam, and it scored substantially higher than the student body population. When you hear these types of statements, and then you see all the JAMA evidence or New England Journal evidence of doctors being at the same level as a machine, there's going to be a lot of conversation. It also demonstrates how far machine learning has actually come. Arnaub: I think there's a few thing that make me believe that we're not at a place where physicians are anywhere close to being replaced. One is that a lot of these AI systems, like if you take the radiology example, they perform what's called narrow AI. These are single tasks, and they're being programmed, and the deep learning models are being set for specific image recognition tasks, so detecting a nodule or looking at a chest CT and looking for a hemorrhage. These are N of one tasks, and they're binary and either yes or no. I think if we keep tasks in this narrow detection focus, we're going to find a lot of interesting things, but what that means is that these are going to be augmenting tools. They're going to help physicians improve diagnostic accuracy, but as we all know, physicians do quite a variety of tasks. There is a substantial amount of mental labor that goes into how physicians diagnose patients. Arnaub: In the short term, I think we're looking for AI to power a lot of solutions that can reduce costs and improve accuracy and augment physician's decision making. I don't see it replacing the tremendous work that docs do or our providers do any time soon. Hugo: Yeah, and I love that you mention narrow AI which, as you said, is algorithms, AI models, to solve specific tasks. I think in the cultural consciousness when people hear AI, they don't think of narrow, weak AI. They think of a strong AI, which reflects human cognition in some sense, and that isn't even necessarily what we want in most places and what we're working towards. Right? Arnaub: Mm-hmm (affirmative). Yeah. That's right. Exactly. It has to be more expansive. I think the other things that's worth mentioning is that there has to be … we talked about this already, but the consistency and the portability in the models has to happen. We're still a long way from integrating this into physician decision making. I think different vendors are focused on different deep learning algorithms and a variety of different use cases. Even certain things, we'll get to this, they're being approved by the FDA, but they have completely different focal points. Until we can start to standardize a lot of that, it's going to take some time. To your point of narrow versus much more expansive thinking of AI, that's also part of the equation, and then how do we actually make this reproducible. How has data science, ML, and AI evolved in the health care space?Hugo: Something that you've mentioned several times is that a lot of the power we see now is from deep learning. You mentioned the use of convolutional neural networks. I'll just step back a bit, and for those people who want a bit of de-mystification of deep learning, deep learning is … and correct me if I'm wrong at any point … is a subclass of machine learning and mostly in supervised learning where you're trying to predict something. This particular type of supervised learning model, which is inspired loosely form neural networks in our physiological systems, in our brains. Arnaub: Yeah, and I think if we're going to generalize it to health care, there's quite a bit … there's a whole variety of different models and sophistication of those modes that are being thrown at different problems. I think at it's very basic level, a lot of early applications of AI in health care were focused on the relationships between diagnoses and medications. Some of the more basic techniques, such as association rule mining or supervised learning, those were meant to come up and find and extract important associations. There are a lot of limitations to those methods, so I think if you look at our methods, they were only looking at item level co-occurrences. They weren't really to abstractions at a higher level. There wasn't a lot of usefulness for data exploration or clinical decision support. Arnaub: And I think if you look at supervised learning techniques, they are tackling these problems from a prediction perspective. If we have the right level of data, we can come up with more non-predictive applications. The things like disease group identifications or patient stratification. There are things that can happen as data becomes much more usable, I guess, for lack of a better word. I think that's where we'll actually be able to see supervised learning become much more applicable, going from small data sets with few observations into much more massive examples. There's great work, for example being done at Stanford and UCFS where they've looked at 100s of thousands of patients over 10 years of longitudinality, billions of observations, and come up with sophisticated deep learning neural networks. I think that's where you're starting to see the far reaching applications of AI. Arnaub: In other cases, we're still working on the data problem, which is that we're getting enough data to make this interesting, but the sophistication of certain models or methods may not be there because the data's, quite frankly, not that good. What does the future of data science, ML, and AI in health care look like to you?Hugo: All that being said, what does the future of data science, ML and AI, in health care looks like to you? Arnaub: Yeah, so I think there's a lot of applications that we haven't talked about yet. I think we've picked on the two easy ones in terms of what's happened and what's been working – disease diagnosis prediction and then on the imaging. I think there's quite a bit of work in terms of what's happening in drug development. The fact that we are looking at companies now … there are exciting startups that are doing this that are focused on things like drug repurposing where they're using real world data and machine learning algorithms to explore the relationships between drug molecules and disease. That is extremely compelling. That's where you're starting to see a lot of funding go into, especially from biotech and pharma, there are companies like BenevolentAI and Numerate and others that are using deep learning to mine a quite vast amount of data to look at everything from scientific papers, clinical trials, they're effectively just trying to just understand which compounds can be more effective at targeting disease. Arnaub: These are the types of things that I think are getting quite a bit of investment, but we haven't seen the fruits of the labor yet. I mentioned Benevolent. They started identifying hypothesis around ALS treatments, and you know this is just a start, but it's starting to narrow down which drug targets or which compounds to go after. It not only saves a tremendous amount of time for biotech and pharma, it also expedites the drug development process. I think that's one example. Arnaub: There are really interesting and powerful examples of genomic data that we haven't talked about yet, so DeepVariant, if I go back to Google for one sec, DeepVariant is an open source tool that was about two years of work between Google Brain and Verily, which is Google's life science arm. What they effectively are able to do is come up with a more sophisticated statistical approach to spot mutations and filter out errors. What DeepVariant does, it changes to whole task of variant calling, which is trying to figure out which base pairs are part of you and they're not part of some kind of processing artifact. It turns it into an image classification problem. Deep variant is starting to replace and outperform these basic biology tools, like GATK and SAM tools, and reducing the amount of error by up to 10 times. Arnaub: This is just, I think, in the beginning stages. Even companies like Google will tell you that their genomics work is a couple years out, considering this one took two years to build. But I'm extremely excited about that type of potential. There are other examples around physician burnout and the advent of voice technology within health care, where we're starting understand that doctors spend an enormous amounts of time on EHR, electronic health record data entry, and if we're able to use machine learning and natural language processing and voice technology in the future, then we start to auto populate structure fields within records, make the doctor's job less burdensome, reduce physician documentation burden. Those are three use cases that I think are on the frontier. They're areas that there's a lot of hype and interest and really amazing work happening, but that's a short list of where I see the future going. Questions from the AudienceLiabilityHugo: Great. Before I go on, there are actually a few interesting questions from the crowd, and Gamal has asked a question, what about liability? I actually want to frame that in terms of thinking about the future of data science and ML and AI in healthcare, and in particular the fact that a lot of the algorithms we've discussed are essentially black box algorithms in terms of it's difficult to see why they make the predictions that they do. So in terms of interpretability versus black box, maybe you can discuss that with respect to, I suppose, liability for the models that we as data scientists build. Arnaub: Yeah, I think that's an incredibly important question. One thing I want to talk about it is the policy space in terms of where the future is. This notion of FDA approved algorithms is actually starting to happen. What we're seeing right now is this lack of consistency, transferability in the current models because they focus on different end points, they are done in a black box setting where it's data in, we're not really sure what comes out. I think what that means is that regulatory bodies are going to intervene, albeit in a positive way. Arnaub: As an example, the American College of Radiology is actually helping to provide methodologies for vendors to verify the effectiveness of the algorithm before they're taken to market. I think that's one example. The other example: about accepting algorithms and approving them is part of diagnosis. They gave a positive vote to a decision support tool that uses an algorithm for neurovascular disease. They did the same thing for diabetic retinopathy in April, and then they did something for a computer aided tool that helps with wrist fractures in adult patients. These are all the FDA's permitting the marketplace to be open. They are allowing algorithms to actually help providers in a regulated way. Arnaub: There's actually really cool stuff happening within the White House and the House Oversight Information Technology Committee. If you guys are extremely bored, you should read this really ominous report called "Rise of the Machines" that the House Oversight Committee just put out. It's basically how is the NIH going to ensure that there's standardization within algorithms. The same thing with the White House. They put out a really interesting plan from the government to build up AI in an ethical way. I think the black box problem is going to continue to happen. We've already seen it be problematic for some large companies. We need to be able to address that, and although we don't love government intervention, I think this is one instance where we're actually seeing a lot of positive things come out of it. Do ethical questions in data science have a much bigger impact on AI in health care, and are there moves towards developing ethical guidelines for researchers in this space?Hugo: Following up on this, we've actually got a great question from someone in the audience called Daniel about ethical questions in general: Do ethical questions in data science have a much bigger impact on AI in health care, and are there moves towards developing ethical guidelines for researchers in this space? You've spoken to that we respective to top down. I'm also wondering about practice from within the data science community. What type of stakeholders will hold data scientists accountable? And also, the fact that in marketing, for example, or advertising perhaps… if you show someone the wrong ad, that doesn't have such an important impact as giving someone the wrong diagnosis, right? Are there things that are particularly valuable in the health space? Arnaub: Yeah, so I think what we're seeing is how do we standardize an ontology for a disease, and that's an evolving question. There are academic consortiums that are focused on reproducing these phenotypes. So a phenotype is basically how are we characterizing a patient and their respective disease. If academic groups and organizations come together to say this is a generally accepted algorithm, this is how we can avoid erroneous cancer treatment advice, or this is how we see this is an unsafe or incorrect treatment recommendation, I think that will actually compel more folks to work within certain parameters and build algorithm that are within guidelines and practice. Otherwise, it's incredibly easy to find signal within a lot of health data noise. I think there are companies that have suffered some hard lessons that way. I think as long as we are working with organizations that are attempting to do this, that's one way of tackling this. Arnaub: I think the other thing is health data is incredibly inconsistent, and there is a national subcommittee called HL-7, which is a health data standards committee. They are really making a strong push for something called FHIR, which is Fast Health Care Interoperability Resourcing. It's trying to create a standard where data is no longer somebody's competitive advantage, but it's something that everyone can use, and it's something that is standardized for everyone. You're not just looking at inconsistent standards. Arnaub: The Centers for Medicare/Medicaid services are really trying to push standard ontologies. I think FHIR and these other organizations are trying to create a consistency behind all the chaos and the noise. Arnaub: Yeah, so that's a good question. I assume that's in relation to drug development, sorry, within pharmacos? Hugo: Yeah, exactly. Arnaub: Yeah, so I think we're starting to see a lot of activity in this space. It's a little bit more nuanced, but in terms of how manufacturing is trying to tackle this, I think we are now in a place where the ability to standardize and create better understanding of how drug cycling takes place, where the supply chain can be optimized. I think that's where there are companies like BERG, for example, that is using AI for not only research applications but for manufacturing. It's something that I come across less, but something that is still popular. I think there are ways to think about unsupervised learning methods in terms of how we're trying to understand drug circulation and where we can improve our supply chain efforts. Arnaub: There is actually a cool effort from the UK Royal Society that is looking at the role of machine learning in bio-manufacturing. Can we actually help optimize the time factor here, like helping manufacturers reduce the time to produce drugs, lower costs, improve replication? Yes, still very much a popular topic. It's not something that we've avoided, but discovery is where I've seen a lot of the money and interest flow to right now. Given the black box nature of AI and the proprietary nature of industry, how will external validation and reproducibility of algorithms be assessed?Hugo: We've got several questions coming through about, I suppose, the ethical nature of using AI and ML and data science in health care. The first one I want to ask you is from a listener called James. James says written given the black box nature of AI and the proprietary nature of industry, how will external validation and reproducibility of algorithms be assessed? He also says, basically, where does open science fit in for the commercial AI space? Arnaub: Yeah, that's a good question. I think what we need to do is come up with more of an interdisciplinary, multi-stakeholder way of evaluating different algorithms that are entering the marketplace. You have these large top down institutions like the FDA that are evaluating the ability for a physician to utilize an algorithm in practice. I think there are other organizations at the academic level that are more interdisciplinary. A great one is called OHDSI, which is the observational health data sciences and informatics group. What they're attempting to do, and this is actually a collaboration between pharma and academics and startups. One thing that they've done that I think is really important is they've created a common data model for health care. They've looked at disparate observational health care databases and decided that EMRs are really important for supporting clinical care. Databases like clean data are important for reimbursement, but they both serve different purposes. We need to create a common data model that accommodates both of these different types of data. Arnaub: This CDM, through a partnership called OMOP, which stands for the Observational Medical Outcomes Partnership, it basically is trying to take all this noise from random coding systems and create one standardized ontology and vocabulary. That's one way of trying to get buy in from other people, multiple players, interdisciplinary players. That's, I think, something that helps with the ethical challenge. Arnaub: OHDSI is an organization that actually works on reproducing and publishing all this research. All of it's open source. They've created a number of software tools like Atlas and Achilles that are standardized databases for profiling different data and data quality. This is not something that we're going to solve overnight. I think regulatory bodies are going to be very judicious about what they approve and what they don't approve. What tends to happen in health care is as soon as there's some sort of adverse event, or there's some kind of clinical error, you're going to see the entire industry get slapped. Nobody wants that to happen. I think that's what's stifling for innovation. Arnaub: We are, hopefully, trying to … It's weird, the world that we sit in right now where we're trying to get as much AI related work out there as possible, also being very mindful that a successful deployment of this, once it enters the physician's hands, or it starts to be part of patient care, is incredibly challenging. That's what the next evolution of all of this stuff is, it's the very careful implementation of these algorithm into a clinical decision model. Is it or will it be enough to prove the efficacy of an algorithm or model, or is a fully, full-functional description required?Hugo: I'm glad that you mentioned regulation there because we have a related question from Stephen, the question is from a regulatory perspective, is it or will it be enough to prove the efficacy of an algorithm or model, or is a fully, full-functional description required? Arnaub: Yeah, I don't know if we have proper guidance around that. I think there are a lot of organizations that are trying to demystify how the AI, or how the FDA should be thinking about this. A few things that are standard in terms of how much do you have to prove something. One is that what is your benchmark data? And are you using … are you using ground truth data? Meaning is it a trusted claims data source? Is it a standardized ontology for EHR data? I think companies grapple with choosing a whole variety of different data sources and collection methods. Then they realize that their algorithm isn't that good, or they're hoping for its approval. There are good definitions on what ground truth is. That's one way of creating a really strong model. Arnaub: I think there are other ways of thinking about what's the intended use of the algorithm. How do we think about this interfacing with a physician? Does it have any downstream patient implications? Is there going to be algorithm bias? Meaning are you going to deny care to a certain patient population? That's something that the FDA considers in terms of how it considers it to be ethical or not ethical. Arnaub: Then I think there's a whole regulatory approach on refitting models so that they're continuously learning. Scott Gottlieb, who runs the FDA, has talked a lot about how will patients evolve, and how do we think about when companies have to do a refit of the model and how it should be validated. What is the right refitting cadence? Is it every hour? Is it six months? Is it annually? I feel like a few organizations have taken a stab at trying to create these lists of guiding light questions that can help us come up with a good model versus a subpar model and one that's more likely to be implemented and accepted by the clinical community versus ones that have a great finding but may have some holes in them. Due to health care being a regulated area, do you feel that AI and health care will be focused area for only big companies like Google and Facebook to be able to make advances? Or do you feel small companies have a space?Hugo: In terms of the regulation, as well we've got a great question from Harsh. Harsh asks that due to health care being a regulated area, do you feel that AI and health care will be focused area for only big companies like Google and Facebook to be able to make advances? Or do you feel small companies have a space? You mentioned earlier that there have been several hundred startups in this space in particular. Maybe you can speak a bit more about it? Arnaub: Sure. I think it's a really interesting question. I think … I'll give you one example that I think raised a to of eyebrows. To your point about big tech companies like Google. Facebook actually announced earlier this year that they are looking at using AI to monitor suicide and understand which one of their users might be more likely to commit a suicidal event. That is a highly ethically challenging place for a tech company to play in. Arnaub: I think that large tech companies, while they have great applications and great computer science, are treading very carefully because they realize that this isn't something that you can just wade into. I think they actually have a tremendous amount of organizational risk as they enter this market. One, because patient care is totally different than selling ads. I think the ability for them to use their science and use the computational power comes at a great risk. They have to evaluate whether it's worth it or not, but they all want to make the world a better place. That's their aspiration. Arnaub: With other companies, there are so many powerful tech companies. I mentioned Voice Technologies in this space. Companies like Virtual Assistance and Voice Technology are going to be major players in this space. And I don't just mean Amazon, but I mean companies like Orbita and others are doing incredible work, Robin AI, they are basically trying to help reduce physician documentation burden. These are well funded, well capitalized, strongly supported startups that are doing great things. There is patient data and risk analytics. There's companies like NarrativeDx that are doing really compelling work. They're partnering directly with health care systems to do this in a safe and compliant way, so I don't think large tech companies are the only one that can play in this space. Arnaub: I think if you are very calculated, methodical about how you enter, if you engage in the right partnerships, a startup … I mean, there are quite a few startups that have made a lot of headway in this space, in the drug discovery world. These are startups that have raised hundreds of millions of dollars, literally, that are now functioning quite well and successfully. Pharma companies are making multi-year bets on companies like Numerate and BenevolentAI and investing quite a bit of money. This is not just a large tech company space anymore. What are the main limitations on the rate of adoption on AI in health care?Hugo: There are actually an overwhelming number of fantastic questions coming through, but we're going to need to wrap up in the next 10 minutes or so. I've got two more questions. The first is from Christopher, which I'm very interested in. Christopher asks what are the main limitations on the rate of adoption on AI in health care? Arnaub: Yeah. That's a good question. We talked a little bit about what are the policy hurdles, and we talked about how do we think about approaches. I think what is the biggest rate limiting step in health care is going to be the ubiquity of good quality data. This is the biggest challenge that I think has been plaguing health care for decades now, is that as soon as a novel data set is released into the health care world, everybody gets really excited about it. As soon as the government made standards for EHR, electronic health records, EHR became competitive domain for any organization that had the record. The challenge was getting access to that data. It's the same thing with genomics now. We're starting to see bio-banks and the ability to have genomically sequenced data, genetically sequenced data. That is the next domain. That's where people are trying to get to, but none of this matters unless the data is linkable, unless there is a standard, unless there is labeled data. We talk a lot about imaging today, but radiologists suffer from the fact that imaging data is stored within these pax warehouses, pax is the archiving system, and then they're not labeled. We don't know what we're necessarily looking at. What that all goes to show is that the biggest hurdle for AI adoption in health care is good quality data, which is why I mentioned standards like FHIR and others trying to create some kind of harmony and consistency in the data in a very chaotic world. Arnaub: I think the other thing is that hospitals and other organizations that have the data are very much willing to work with players, but there's quite a bit of overlap in terms of what companies are promising. We're starting to see a lot of companies tread into different spaces and say that they're doing compound development or they're looking at molecule identification or target validation. They're trying to be jack of all trades. I think that is obfuscating what the company actually does. Arnaub: My suggestion is just having a very clear, refined focus on what you think you are doing and what you're good at versus trying to then wade into a lot of other murky waters. With that said, I mean, the market is so hot right now that you will see a tremendous amount of partnership and opportunity for startups. The biggest, limiting step is access to the data, finding the right partner, being able to demonstrate a use case, and then the application of that algorithm within clinical practice. Do you think artificial intelligence will democratize medicine?Hugo: I've got one more question from one of our listeners, and then I'm going ask you one final question. This is from Gamal, and it's a relatively general question that I'd like you to interpret in whatever way you see fit. Do you think artificial intelligence will democratize medicine? Arnaub: Oh, interesting. I think that we will get to a place where … I'm going to be liberal about the use of the world democratize. I think what that means is enable access to care, perhaps, or maybe that's the definition that we'll choose to use. I think patients are increasingly interfacing with the health system in different ways, and the fact that the majority, the vast majority, of patients go online to look up health information, almost 90% now. The fact that there is still … there's a lot of ways for patients to share their data now with physicians, with technology companies. We all know the work that Apple's doing in its work in health kit and research kit to try to get more access to data. I think there is going to be some greater role for AI, and maybe for technology to help with access to care. And hopefully I'm addressing your question, but feel free to rephrase. Arnaub: At the same time the US is suffering from tremendous endemic health policy challenges that I don't think AI will fix. I think AI will enable and help certain things. It will maybe power diagnosis. Maybe it will improve better health outcomes over time. There's still a good portion of the population that will never be AI enabled, for lack of a better word, or have access to health care resources. I think that's the greatest hurdle in our system. Call to ActionHugo: That definitely does answer the question. My final question for you is: for all our listeners out there, do you have a final call to action? Arnaub: Yeah. I think we've talked a lot about challenges. We've also talked a lot about promise and where the industry is going. I think this concept of fixing a lot of low-hanging fruit problems, we've picked on a lot of sexier things like drug development, but our health care system suffers from tremendous waste. These are enormous problems, and AI can fix a lot of these things, like insurance and billing claims. My old mentors used to say that a lot of the most lucrative work in health care is also the least sexy and the back office application type stuff. Arnaub: If we're able to do things like predict better waste or fraud, or if we're able to improve billing and documentation processes, these are incredibly important problems to go after, and I think there's something there. You should use AI and your powers to go fix them. Arnaub: I think the other thing is that these problems shouldn't be done in isolation, or fixed in isolation. You are going to see a lot of different and perhaps unique partnerships in health care take place. Hospitals and tech companies and patient groups working with startups. I think that whole model has flipped on its head. I encourage everyone to be very inventive about how they want to work with different parties. There are a lot of non-traditional folks that are getting into the health care space, so think about where the intersections lie and where the cross-functionality lies. That's where you usually find more inventive solutions as opposed to working through the same channels. Hugo: Thanks, Arnaub. Arnaub: Yeah, thank you, Hugo. Thanks to DataCamp for the time. I really appreciate the opportunity. Arnaub: Thank you.
To leave a comment for the author, please follow the link and comment on their blog: DataCamp Community - r programming. R-bloggers.com offers daily e-mail updates about R news and tutorials on topics such as: Data science, Big Data, R jobs, visualization (ggplot2, Boxplots, maps, animation), programming (RStudio, Sweave, LaTeX, SQL, Eclipse, git, hadoop, Web Scraping) statistics (regression, PCA, time series, trading) and more... This posting includes an audio/video/photo media file: Download Now |
| Posted: 29 Oct 2018 08:00 AM PDT (This article was first published on R – Curtis Miller's Personal Website, and kindly contributed to R-bloggers) IntroductionNow that we've seen MCHT basics, how to make
Bootstrap Hypothesis TestingLet Here, There are many ways to generate the data used to compute Unlike Monte Carlo tests, bootstrap tests cannot claim to be exact tests for any sample size; they're better for larger sample sizes. That said, they often work well even in small sample sizes and thus are still a good alternative to inference based on asymptotic results. They also could serve as an alternative approach to the nuisance parameter problem, as MMC often has weak power. Bootstrap Testing in MCHTIn MCHT, there is little difference between bootstrap testing and Monte Carlo testing. Bootstrap tests need the original dataset to generate replicates; Monte Carlo tests do not. So the difference here is that the function passed to That's the only difference. All else is the same. Nonparametric Bootstrap ExampleSuppose we wish to test for the location of the mean. Our nonparametric bootstrap procedure is as follows:
The code below implements this procedure. library(MCHT) library(doParallel) registerDoParallel(detectCores()) ts <- function(x, mu = 0) { sqrt(length(x)) * (mean(x) - mu)/sd(x) } rg <- function(x) { x_demeaned <- x - mean(x) sample(x_demeaned, replace = TRUE, size = length(x)) } sg <- function(x, mu = 0) { x <- x + mu test_stat(x, mu = mu) # Will be localizing } b.t.test <- MCHTest(ts, sg, rg, seed = 123, N = 1000, lock_alternative = FALSE, test_params = "mu", localize_functions = TRUE) dat <- c(2.3, 1.1, 8.1, -0.2, -0.8, 4.7, -1.9) b.t.test(dat, alternative = "two.sided", mu = 1) ## ## Monte Carlo Test ## ## data: dat ## S = 0.68164, p-value = 0.432 ## alternative hypothesis: true mu is not equal to 1 b.t.test(dat, alternative = "less", mu = 7) ## ## Monte Carlo Test ## ## data: dat ## S = -3.8626, p-value = 0.025 ## alternative hypothesis: true mu is less than 7 Parametric Bootstrap TestThe parametric bootstrap test assumes that the observed data was generated using a specific distribution, such as the Gaussian distribution. All that's missing, in essence, is the parameters of that distribution. The procedure thust starts by estimating all nuisance parameters of the assumed distribution using the data. Then the first step of the process mentioned above (which admittedly was specific to a test for the mean but still strongly resembles the general process) is replaced with simulating data from the assumed distribution using any parameters assumed under the null hypothesis and the estimated values of any nuisance parameters. The other two steps of the above process are unchanged. We can use the parametric bootstrap to test for goodness of fit with the Kolmogorov-Smirnov test. Without going into much detail, suppose that That is, we want to test whether our data was drawn from the distribution R implements this test in Since the distribution of the data is known under the null hypothesis, this is a good situation to use a bootstrap test. We'll use maximum likelihood estimation to estimate the values of the missing parameters, as implemented by fitdistrplus (see [2]). Then we generate samples from this distribution using the estimated parameter values and use those samples to generate simulated test statistic values that follow the distribution prescribed by the null hypothesis. Suppose we wished to test whether the data was drawn from a Weibull distribution. The result is the following test. library(fitdistrplus) ts <- function(x) { param <- coef(fitdist(x, "weibull")) shape <- param[['shape']]; scale <- param[['scale']] ks.test(x, pweibull, shape = shape, scale = scale, alternative = "two.sided")$statistic[[1]] } rg <- function(x) { n <- length(x) param <- coef(fitdist(x, "weibull")) shape <- param[['shape']]; scale <- param[['scale']] rweibull(n, shape = shape, scale = scale) } b.ks.test <- MCHTest(test_stat = ts, stat_gen = ts, rand_gen = rg, seed = 123, N = 1000) b.ks.test(rweibull(1000, 2, 2)) ## ## Monte Carlo Test ## ## data: rweibull(1000, 2, 2) ## S = 0.021907, p-value = 0.275 b.ks.test(rbeta(1000, 2, 2)) ## ## Monte Carlo Test ## ## data: rbeta(1000, 2, 2) ## S = 0.047165, p-value < 2.2e-16 ConclusionGiven the choice between a MMC test and a bootstrap test, which should you prefer? If you're concerned about speed and power, go with the bootstrap test. If you're concerned about precision and getting an "exact" test that's at least conservative, then go with a MMC test. I think most of the time, though, the bootstrap test will be good enough, even with small samples, but that's mostly a hunch. Next week we will see how we can go beyond one-sample or univariate tests to multi-sample or multivariate tests. See the next blog post. References
Packt Publishing published a book for me entitled Hands-On Data Analysis with NumPy and Pandas, a book based on my video course Unpacking NumPy and Pandas. This book covers the basics of setting up a Python environment for data analysis with Anaconda, using Jupyter notebooks, and using NumPy and pandas. If you are starting out using Python for data analysis or know someone who is, please consider buying my book or at least spreading the word about it. You can buy the book directly or purchase a subscription to Mapt and read it there. If you like my blog and would like to support it, spread the word (if not get a copy yourself)!
To leave a comment for the author, please follow the link and comment on their blog: R – Curtis Miller's Personal Website. R-bloggers.com offers daily e-mail updates about R news and tutorials on topics such as: Data science, Big Data, R jobs, visualization (ggplot2, Boxplots, maps, animation), programming (RStudio, Sweave, LaTeX, SQL, Eclipse, git, hadoop, Web Scraping) statistics (regression, PCA, time series, trading) and more... This posting includes an audio/video/photo media file: Download Now |
| Data Science With R Course Series – Week 7 Posted: 29 Oct 2018 02:15 AM PDT (This article was first published on business-science.io - Articles, and kindly contributed to R-bloggers) After week 7, you will be able to communicate confidently which model features are the most important. Interpretability is a very important topic in machine learning. The automated machine learning tool, In this week's curriculum, you learn how to explain "black-box" machine learning models with Here is a recap of our trajectory and the course overview: Recap: Data Science With R Course SeriesYou're in the Week 7: Machine Learning Interpretability with LIME. Here's our game-plan over the 10 articles in this series. We'll cover how to apply data science for business with R following our systematic process.
Week 7: Machine Learning Interpretability with LIME Student Feedback Week 7: Machine Learning Interpretability with LIMEOverview & SetupThe Overview & Setup will walk through the setup to support After understanding the features that make up your machine learning model, you will be able to answer the critical business question, Why is employee churn happening? Feature Explanation With LIMEJump right into learning about the Challenge #4In this 2 part challenge, you will recreate a single explanation plot and a full explanations plot to visualize important features. After you complete the challenge, walk through the Solution videos to compare and review your working solution. You Need To Learn R For Business
To be efficient as a data scientist, you need to learn R. Take the course that has cut data science projects in half (see this testimonial from a leading data science consultant) and has progressed data scientists more than anything they have tried before. Over 10-weeks you learn what it has taken data scientists 10-years to learn:
Next UpThe next article in the Data Science With R Series covers Evaluation: Calculating The Expected ROI (Savings) Of A Policy Change. Learn how to communicate the cost savings of using your model. Inform the business to make decisions around time and resources based on the value of your findings. Use the Expected Value Framework after your model is complete to explain which features are most important. The Expected Value Framework is a method to calculate savings from implementing business changes based on the model's results. Week 8: Evaluation: Calculating The Expected ROI (Savings) Of A Policy Change New Course Coming Soon: Build A Shiny Web App!You're experiencing the magic of creating a high performance employee turnover risk prediction algorithm in DS4B 201-R. Why not put it to good use in an Interactive Web Dashboard? In our new course, Build A Shiny Web App (DS4B 301-R), you'll learn how to integrate the H2O model, LIME results, and recommendation algorithm building in the 201 course into an ML-Powered R + Shiny Web App! Shiny Apps Course Coming in October 2018!!! Sign up for Business Science University Now!
Building an R + Shiny Web App, DS4B 301-R
To leave a comment for the author, please follow the link and comment on their blog: business-science.io - Articles. R-bloggers.com offers daily e-mail updates about R news and tutorials on topics such as: Data science, Big Data, R jobs, visualization (ggplot2, Boxplots, maps, animation), programming (RStudio, Sweave, LaTeX, SQL, Eclipse, git, hadoop, Web Scraping) statistics (regression, PCA, time series, trading) and more... This posting includes an audio/video/photo media file: Download Now |
| About a Curious Feature and Interpretation of Linear Regressions Posted: 29 Oct 2018 01:00 AM PDT (This article was first published on Economics and R - R posts, and kindly contributed to R-bloggers) A small blog post with a riddle, simulation, theory and a concluding rhyme. Consider a fictitious example in which we have collected a sample of somewhat overweight persons for which we measured weight in kg as $y$ and height in cm as $x$. We estimate the following simple linear regression: One early message in our Economics 101 course is that for such a regression with non-experimental data, one should not interpret the estimated coefficient $\hat \beta_1$ in a causal way, by saying that one more cm height leads to one more kg weight. One should rather interpret $\hat \beta_1$ as a quantitative measure of the linear relationship between $x$ and $y$, e.g. using a formulation like:
A simulation study with an interesting findingLet us move towards the curious feature that I promised in the title. Consider the following simple R code that simulates data for a simple linear regression model with $\beta_0=0$ and $\beta_1=1$. If we estimate that model, we indeed find a slope $\hat \beta_1$ close to 1 in our sample: If for a given data set we want to assume nothing about the causal structure, we may as well estimate a simple linear regression with $x$ as the dependent variable and $y$ as the explanatory variable: To make this blog entry a bit more interactive, I have added quiz powered by Google forms, where you can make a guess about the rough slope of the regression above. … scroll down to continue…
Here is the result of the regression: Interestingly, the slope is now close to $1/2$ instead of $1$! Being not a statistician by training, I must admit that I was quite surprised by this result. After all, if we would ignore the disturbances and just had a simple line $y=x$ with slope $1$, the slope stays $1$ if we just swap the sides of $x$ and $y$ to get the line $x=y$. Of course, the observed result is fully consistent with the mathematics of the simple least squares estimator. The estimated slope of a simple linear regression of $y$ on $x$ is given by Let $\hat \alpha_1$ denote the estimated slope of the regression of $x$ on $y$. We have Since the covariance is symmetric, i.e. $Cov(x,y) = Cov(y,x)$, we thus find The ratio of the slopes of the two regressions is equal to the ratio of the sample variances of $x$ and $y$. In our data generating process $y$ as the sum of $x$ and $\varepsilon$ has twice the variance than $x$, which also holds approximately for the sample variances: To get more intuition, let us look at a scatter plot with y on the vertical and x on the horizontal axis. We have so far two candidate regression lines to account for the relationship between $x$ and $y$. First the red line with slope $\hat \beta_1 \approx 1$ from the regression of $y$ on $x$. Second the blue line with slope $\frac{1}{\alpha_1} \approx 2$, where $\alpha_1$ is the slope from the linear regression of $x$ on $y$.
From eye-sight, I could not tell which of the two lines provides a better linear approximation of the shape of the point cloud. While the red line minimizes the sum of squared vertical distance from the points to the line, the blue line minimizes the sum of squared horizontal distances. So what about our interpretation of the regression slope?So, should I present in my introductory course something like the following pair of simplified interpretations of estimated regression slopes?
and
Well, this seems like a good method to generate headaches, get dozens of emails that there must be a typo in my script, and to cause a significant drop of my course evaluation… Orthogonal RegressionInstead of minimizing the vertical or horizontal residuals, one could minimize the Euclidean distance of each observation to the regression line. This is done by a so called Orthogonal Regression. Looking up Wikipedia, we find the following formula for the slope of an orthogonal regression of $y$ on $x$: where $s_{xx}$ and $s_{yy}$ are the sample variances of $x$ and $y$, respectively, and $s_{xy}$ is the sample covariance. Let $\tilde \alpha_1$ be the slope of the orthogonal regression of $x$ on $y$. One can show that both slopes indeed satisfy the relationship that we get when swapping $y$ and $x$ for a deterministic linear curve, i.e. We can also verify this numerically with R: The following plot shows the result orthogonal regression line through our point cloud in dark-green.
By eye-sight the green orthogonal regression line seems indeed better describe the linear relationship of the point cloud. Conclusion?If we just want to have a simple quantitative measure for the linear relationship between two variables, there indeed seems to be some merit for running an orthogonal regression instead of a simple linear regression. Yet, there are many reasons to focus just on simple linear regressions. For example, it more closely relates to the estimation of causal effects and the estimation of parameters of structural models. So maybe one should always introduce the linear regression model with all relevant assumptions and then stick to a more precise non-causal interpretation for the slope of a simple linear regression, like: "If we observe a 1 cm higher height, our best linear unbiassed prediction for the weight increases by $\hat \beta_1 = 1$ kg." But I don't see how that would be a good strategy for my Econ 101 course. In the end, statistics is subtle and some simplifications in introductory classes just seem reasonable. I guess, I will just stick in my course with both: simple least squares regression and the simple interpretation. I just will follow this advice:
To leave a comment for the author, please follow the link and comment on their blog: Economics and R - R posts. R-bloggers.com offers daily e-mail updates about R news and tutorials on topics such as: Data science, Big Data, R jobs, visualization (ggplot2, Boxplots, maps, animation), programming (RStudio, Sweave, LaTeX, SQL, Eclipse, git, hadoop, Web Scraping) statistics (regression, PCA, time series, trading) and more... This posting includes an audio/video/photo media file: Download Now |
| crfsuite for natural language processing Posted: 29 Oct 2018 12:43 AM PDT (This article was first published on bnosac :: open analytical helpers - bnosac :: open analytical helpers, and kindly contributed to R-bloggers) A new R package called crfsuite supported by BNOSAC landed safely on CRAN last week. The crfsuite package (https://github.com/bnosac/crfsuite) is an R package specific to Natural Language Processing and allows you to easily build and apply models for
The focus of the implementation is on allowing the R user to build such models on his/her own data, with your own categories. The R package is a Rcpp interface to the popular crfsuite C++ package which is used a lot in all kinds of chatbots. In order to facilitate creating training data on your own data, a shiny app is made available in this R package which allows you to easily tag your own chunks of text, with your own categories, which can next be used to build a crfsuite model. The package also plays nicely together with the udpipe R package (https://CRAN.R-project.org/package=udpipe), which you need in order to extract predictive features (e.g. parts of speech tags) for your words to be used in the crfsuite model. On a side-note. If you are in the area of NLP, you might also be interested in the upcoming ruimtehol R package which is a wrapper around the excellent StarSpace C++ code providing word/sentence/document embeddings, text-based classification, content-based recommendation and similarities as well as entity relationship completion.
You can get going with the crfsuite package as follows. Have a look at the package vignette, it shows you how to construct and apply your own crfsuite model. ## Install the packages More details at the development repository https://github.com/bnosac/crfsuite where you can also provide feedback. Training on Text Mining Are you interested in how text mining techniques work, then you might be interested in the following data science courses that are held in the coming months.
To leave a comment for the author, please follow the link and comment on their blog: bnosac :: open analytical helpers - bnosac :: open analytical helpers. R-bloggers.com offers daily e-mail updates about R news and tutorials on topics such as: Data science, Big Data, R jobs, visualization (ggplot2, Boxplots, maps, animation), programming (RStudio, Sweave, LaTeX, SQL, Eclipse, git, hadoop, Web Scraping) statistics (regression, PCA, time series, trading) and more... This posting includes an audio/video/photo media file: Download Now |
| RStudio IDE Custom Theme Support Posted: 28 Oct 2018 05:00 PM PDT (This article was first published on RStudio Blog, and kindly contributed to R-bloggers) We're excited to announce that RStudio v1.2 has added support for custom editor themes. Custom editor themes will allow you to adjust the background color of the editor and syntax highlighting of code in RStudio to better suit your own personal style. New editor themes can be added to RStudio by importing a tmTheme or sharing an existing rstheme file. The tmTheme file format was first introduced for the TextMate editor, and has since become a standard theme format. The rstheme format is specific to RStudio. Importing a Custom ThemeBefore you can add a theme to RStudio, you'll have to find a theme in the right format. This online tmTheme editor will allow you to create your own tmThemes or download an existing theme from a large collection of themes. If you are interested in writing your own theme be sure to read this RStudio Extensions article about writing themes. Once you have a tmTheme or rstheme file for your favorite theme or themes, you can import it to RStudio. Follow the instructions below to import a theme.
The theme pictured in these examples is called Night Owlish, and was adapted from the Night Owl theme by RStudio's own Mara Averick. It can be found on her github page. Removing a Custom ThemeIf you accidentally added a theme, or you want to add an updated version, you can remove the theme from RStudio. To do so, follow the instructions below.
Sharing ThemesIf you've found (or made) a really cool theme that you want to share, you can do so just by sharing the tmTheme or rstheme file. Then the recipient can import it as per the instructions in the Importing a Custom Theme section. There is no difference between sharing the tmTheme file, or the rstheme file that is generated after the theme gets imported to RStudio, unless you or someone else has made changes to the rstheme file itself. rstheme files can be found in the Some of Our Favorite ThemesTo find out more about themes in RStudio, check out this support article about themes. In the meantime, here is RStudio styled using some of our favorite themes: Ayu Dark, Light, and Mirage by dempfi:
This theme is an example of a theme where the rstheme file was modified directly. Without editing the rstheme file, it wouldn't have been possible to change the style of non-editor elements of RStudio, like the tabs above the different panes. To learn more about creating new custom themes for RStudio, take a look at this RStudio Extensions article about writing themes. We look forward to seeing what great new themes the RStudio community comes up with! You can download the RStudio 1.2 Preview Release at https://www.rstudio.com/products/rstudio/download/preview/. If you have any questions or comments, please get in touch with us on the community forums.
To leave a comment for the author, please follow the link and comment on their blog: RStudio Blog. R-bloggers.com offers daily e-mail updates about R news and tutorials on topics such as: Data science, Big Data, R jobs, visualization (ggplot2, Boxplots, maps, animation), programming (RStudio, Sweave, LaTeX, SQL, Eclipse, git, hadoop, Web Scraping) statistics (regression, PCA, time series, trading) and more... This posting includes an audio/video/photo media file: Download Now |
| Reproducible Finance, the book! And a discount for our readers Posted: 28 Oct 2018 05:00 PM PDT (This article was first published on R Views, and kindly contributed to R-bloggers) I'm thrilled to announce the release of my new book Reproducible Finance with R: Code Flows and Shiny Apps for Portfolio Analysis, which originated as a series of R Views posts in this space. The first post was written way back in November of 2016 – thanks to all the readers who have supported us along the way! If you are familiar with the R Views posts, then you probably have a pretty good sense for the book's style, prose, and code approach, but I'd like to add a few quick words of background. The book's practical motivations are: (1) to introduce R to finance professionals, or aspiring finance professionals, who wish to move beyond Excel for their quantitative work, and (2) to introduce various finance coding paradigms to R coders. The softer motivation is to demonstrate and emphasize readable, reusable, and reproducible R code, data visualizations, and Shiny dashboards. It will be very helpful to have some background in the R programming language or in finance, but the most important thing is a desire to learn about the landscape of R code and finance packages. An overarching goal of the book is to introduce the three major R paradigms for portfolio analysis: If that 'three-universe' structure seems a bit unclear, have a quick look back at this post on skewness and this post on kurtosis, and you'll notice that we solve the same task and get the same result with different code paths. For example, if we had portfolio returns saved in a tibble object called We next would use the tidyverse and run our calculations in a piped flow: And then head to the We can compare our three Sharpe objects and confirm consistent results. We might be curious how the Sharpe-Ratio-to-standard-deviation ratio of our portfolio compares to those of the component ETFs and a  Figure 1: Sharpe versus Standard Deviation Finally, we are ready to calculate and visualize the Sharpe Ratio of a custom portfolio with Shiny and a flexdashboard, like the one found here. As in the above example, most tasks in the book end with data visualization and then Shiny (a few early readers have commented with happy surprise that all the charts and code are in full color in the book – thanks to CRC press for making that happen!). Data visualization and Shiny are heavily emphasized – more so than in other finance books – and that might seem unusual. After all, every day we hear about how the financial world is becoming more quantitatively driven as firms race towards faster, more powerful algorithms. Why emphasize good ol' data visualization? I believe, and have observed first-hand, that the ability to communicate and tell the story of data in a compelling way is only going to become more crucial as the financial world becomes more complex. Investors, limited partners, portfolio managers, clients, risk managers – they might not want to read our code or see our data, but we still need to communicate to them the value of our work. Data visualization and Shiny dashboards are a great way to do that. By book's end, a reader will have built a collection of live, functioning flexdashboards that can be the foundation for more complex apps in the future. If you've read this far, good news! Between now and December 31, 2018, there's a 20% discount on the book being run at CRC, and if you don't see it applied, readers can use discount code SS120 on the CRC website. The book is also available on Amazon as Kindle or paperback (but there's only than 10 copies left as of right now). Thanks so much for reading, and happy coding!
To leave a comment for the author, please follow the link and comment on their blog: R Views. R-bloggers.com offers daily e-mail updates about R news and tutorials on topics such as: Data science, Big Data, R jobs, visualization (ggplot2, Boxplots, maps, animation), programming (RStudio, Sweave, LaTeX, SQL, Eclipse, git, hadoop, Web Scraping) statistics (regression, PCA, time series, trading) and more... This posting includes an audio/video/photo media file: Download Now |
| Is the answer to everything Gaussian? Posted: 28 Oct 2018 04:00 PM PDT (This article was first published on Theory meets practice..., and kindly contributed to R-bloggers) Abstract:As an applied statistician you get in touch with many challenging problems in need of a statistical solution. Often, your client/colleague already has a working solution and just wants to clarify a small statistical detail with you. Equally often, your intuition suggests you that the working solution is not statistically adequate, but how to substantiate this? As motivating example we use the statistical process control methodology used in Sarma et al. (2018) for monitoring a binomial proportion as part of a syndromic surveillance kit.  IntroductionA few weeks ago I became aware of the publication by Sarma et al. (2018), who as part of a syndromic surveillance system monitor the time series of a proportion with the aim of timely detecting changes. What initially caught my intention was their figure 1A:  Figure : Figure 1A from Sarma et al. (2018) showing the time series of proportions that reports of acute respiratory infection make up of all syndrome reports that day. Reading the details of the paper reveals that the number of daily counts on 14 syndromes is collected and for each syndrome the proportion of the particular syndrome out of all syndrome reports is calculated. In other words: given that the counts for a particular day \(t\) are \(y_{it}, i=1, \ldots, 14\), the monitored proportion is \(p_{it} = y_{it}/\sum_{j=1}^{14} y_{jt}\). It is thus clear that it's impossible to get beyond 100%. The more surprising was that the upper level in the figure goes beyond it – a sign of an inadequate statistical method. What the authors do is to compute an upper threshold for a particular day \(t_{0}\) as follows: \[ is the mean and standard deviation of the \(d\) baseline observations1, respectively, and \(k\) is a tuning parameter – for 12 out of the 14 syndromes \(k=2\) is used, but for the two syndromes with highest proportions, including acute respiratory infections, \(k=4\) is used. As the method looks like an adaptation of the simple EARS method (Fricker, Hegler, and Dunfee 2008) to proportions this caused me to tweet the following critical remark (no harm intended besides the scientific criticism of using a somewhat inadequate statistical method):  To which one of the authors, Alexander Ullrich, replied  Initially, I replied by twitter, but realized that twitter is not a good format for a well-balanced and thorough scientific discourse. Also, my answers lacked exemplification and supporting numbers, so I deleted the answers and shall instead use this blog post to provide a thorough answer. Please note that my discussion focuses on the paper's statistical methodology approach – I do think the published application is very important and I'm happy to see that the resulting Excel tool is made available to a greater audience under a creative common license! As much I can understand the motives, working in applied statistics is always a balance between mathematical exactness and pragmatism. A famous quote says that things should be as simple as possible, but not simpler. But if mathematical rigour always is second, something is amiss. In this light, I'd like to comment on the four reasons given in Alexander's reply. Reason 1 & 2:In principle I agree and taking a non-parametric and distribution free approach is healthy, if you fear your assumptions are more quickly violated than you can formulate them. Using mean plus two times standard deviation of the \(d=15\) baseline counts does, however, imply certain assumptions. It means that you believe the distribution being sufficiently stable that the expectation and standard deviation estimated from the baseline values is indicative for the next observation's expectation and standard deviation. In other words: no trends, no day of the week effects no previous outbreaks are allowed in the baseline. Looking at the jump of the upper-bound line after the single peak in June 2016 in Fig 1A one might conclude that this might be a problematic assumption. Furthermore, one assumes the distribution is sufficiently symmetric such that its quantiles can be described as a number of times the standard deviations away from the mean. Finally, by using the usual formula to estimate the standard deviation one assumes that the observations are independent. They are likely not and, hence, the estimated standard deviation might be too small. All these limitations need to be mentioned, and probably are the biggest problem with the method, but could be addressed by semi-simple modelling approaches as done, e.g., in Farrington et al. (1996) for counts. For the remainder of this post, I shall instead focus on using the mean plus two times standard deviation (sd) rule as I have seen it in too many times – also in other surveilance contexts. The problem we are solving is a statistical one, so writing that the k-times-sd-rule is not meant to have a probabilistic interpretation leaves the user alone with the choice of threshold. In particular many users will know from their Statistics 101 class that mean plus/minus two times sd is as a way to get approximately 95% of the mass for anything which has a Gaussian shape. Due to the central limit theorem this shape will apply to a certain degree. So what we do is to compare an out-of-sample observation with a threshold. In this case the prediction interval for the observation is the statistical correct object for the comparison. Because the standard deviation is estimated from data, the prediction interval should be based on quantiles of a t-distribution with \(d-1\) degrees of freedom. In this case the appropriate upper limit of a two-sided \((1-\alpha)\cdot 100%\) prediction interval is given as \[ With \(d=15\)2 the upper limit of a one-sided 97.5% prediction interval would have the multiplication factor 2.22 on the estimated standard deviation. Thus using a factor of 2 instead means your procedure is slightly more sensitive than a the possibly anticipated 2.5% false alarm probability. Calculations show that the false alarm probability under the null hypothesis is 3.7% (assuming the Gaussian assumption holds). Altogether, one can say that this in the \(d=15\) case, for the sake of simplicity, the difference appears ignorable. Had \(d\) been smaller the difference becomes more relevant though. Reason 3I'm not sure I got the point, but one problem is that if your baseline consists of the observations are \(y\), \(y\), \(\ldots\), \(y\) then the upper limit by your method will also be \(y\), as the estimated standard deviation will be zero. Another problem is if the denominator \(n_t\) is zero, but because this appears to have a regular shape (no reports on weekends), this can just be left out of the modelling? Reason 4This reason I find particular troublesome, because it is an argument statisticians hear often. A wider audience expects a valid statistical method, not more complicated than necessary, but sound and available within the tools at hand. I argued above that two times standard deviation for proportions might be working, but you implicitly leave a lot of problems for the user to solve due to insufficient statistical modelling. I agree that too complicated might not work, but if -for the sake of pragmatism- we neither inform or quantify potential problems of a too simplistic solution nor fail to provide something workable which is better, we'll be out of a job quickly. Can we do better?Initially it appeared natural to either try a data or parameter transformation in order to ensure that the computed upper limit respects the \([0,1]\) bound. However, all suggestions I tried proved problematic one way or the other, e.g., due to small sample sizes. Instead, a simple Bayesian and a simple non-parametric variant are considered. Beta-BinomialA simple approach is to use a conjugate prior-posterior Bayesian updating scheme. Letting \(\pi\) be the true underlying proportion, we assume a \(\operatorname{Be}(0.5, 0.5)\) prior for it initially. Observing \(y_{t} \sim \operatorname{Bin}(n_t, \pi)\) for \(t=t_0-d, \ldots, t_0\), the posterior for \(\pi\) will be \[ A simple variant of this procedure is to use a plug-in type prediction interval by obtaining the upper limit as the 97.5% quantile of the binomial with size parameter \(n_{t_0}\) and probability \(p_{t_0}\). However, this approach ignores all uncertainty originating from the estimation of \(p_{t_0}\) and, hence, is likely to result in somewhat narrower prediction intervals than the Beta-Binomial approach. Non-parametricA one-sided 97.5% prediction interval \([0, U]\) based on the continuous values \(p_{t_0-39},\ldots, p_{t_0-1}\) without ties is given as (see e.g. Arts, Coolen, and van der Laan (2004) or the Wikipedia entry on non-parametric prediction intervals): \[ Simulation StudyWe consider the false alarm proportion of the suggested method (2 times and 4 times standard deviation, as well as the prediction interval method and a beta-binomial approach by simulating from a null model, where \(d+1\) observations are iid. from a binomial distribution \(\operatorname{Bin}(25, \pi)\). The first \(d\) observations are used for estimation and then upper limit computed by the algorithm is compared to the last observations. Note: the non-parametric method requires the simulation of 39+1 values. For all methods: If the last observation exceeds the upper limit an alarm is sounded. We will be interested in the false alarm probability, i.e. the probability that an alarm is sounded even though we know that the last observation originates from the same model as the baseline parameters. For the methods using a 97.5% one-sided prediction interval, we expect this false error probability to be 2.5%. The function implementing the six algorithms to compare looks as follows: This can be wrapped into a function performing a single simulation : We then perform the simulation study using several cores using the  Figure 2: False positive probability for different \(\pi\) values each estimated by 10,000 Monte Carlo simulations. In the figure we see that both the two and four times standard deviation approach (twosd, foursd) as well as the approach based on the 97.5% predictive distribution in a Gaussian setting (pred) have a varying FAP over the range of true proportions: The smaller \(\pi\) the higher the FAP. The FAP can be as high as 7% instead of the nominal 2.5%. When monitoring 145 time points this means that we will on average see \(145\cdot 0.07\)=10 false alarms, if the process does not change. This is somewhat problematic, because it means that the behaviour of the detection procedure depends on the underlying \(\pi\): the user will get way more false alarm at low \(\pi\)'s than possibly expecting. Altogether, it appears better to use a slightly higher threshold than 2. However, \(k=4\) looks awfully conservative! All considered procedures dip down to a FAP of 0% for \(\pi\) near 100%, which means no alarms are sounded here. This is related to the fact that if \(U_{t_0}=n_{t_0}\) than because \(p_{t_0} > U_{t_0}\) is required before an alarm will be sounded, no alarm is possible. Furthermore, both the beta-binomial, the binomial variant and the non-parametric procedure have FAPs slightly lower than the nominal 2.5%. This is again related to the discreteness of the problem: It might not be possible to find an integer limit \(U\) such that the CDF at \(U\) is exactly 97.5%, i.e. usually \(F(q_{0.975})>0.975\). Because we only sound alarms if \(y_{t_0} > U\), i.e. the probability for this to occur is even smaller, namely, \(1-F(q_{0.975}+1)\). Note that in the above simulation study the binomial and beta-binomial models are in advantage, because the model used to simulate data is identical and closely identical, respectively, to how data are simulated. In order to make the simulation more comprehensive we investigate an additional scenario where the marginal distribution are binomial \(\operatorname{Bin}(25, 0.215)\), but are correlated3. We simulate variables \(y_t^*\) using an \(AR(1)\) process with parameter \(\rho\), \(|\rho| < 1\), i.e. \[ \(y_t\) = qbinom(pnorm(ystar[t]))Altogether, this corresponds to a Gaussian copula approach to generate correlated random variables with a given marginal distribution. The correlation between the \(y_t\) will not be exactly be \(\rho\) due to the discrete nature of the binomial, but will approach \(\rho\) as \(n\) in the binomial becomes large. Figure 3 shows the results for the false alarm probability based on 10,000 Monte Carlo simulations for marginal \(\operatorname{Bin}(25, 0.215)\) distribution and latent \(AR(1)\) one-off-the-diagonal correlation parameter \(\rho\).
We see that the binomial and beta binomial approaches sound too many alarms as the correlation increases. Same goes for the two times standard deviation and the predictive approach. The non-parametric approach appears to behave slightly better. ApplicationWe use the synthetic acute respiratory infection data made available as part of the paper's SySu Excel tool available for download under a creative common license. In what follows we focus on the time series for the symptom acute respiratory infections. Figure shows the daily proportions 2017-01-01 until 2017-07-20 for all weekdays as vertical bars. Also shown is the upper threshold \(U_t\) for six methods discussed above.  Figure 4: Upper bound curves for all detection procedures. The correlation between \(p_{t}\) and \(p_{t-1}\) in the time series is 0.04, which could be a sign that the synthetic were artificially generated using an independence assumption. For all algorithms we see the effect on the upper threshold as spikes enter the baseline values. In particular the non-parametric method, which uses \(d=39\) baseline values, will only sound an alarm during 39 days after time 60, if the proportion is larger than the \(p_{60} = 69.6%\) spike . DiscussionThis post discussed how to use statistical process control to monitor a proportion in a syndromic surveillance context. The suitability and performance of Gaussian approximations was discussed: It was shown that the false alarm probability for this approach depends on the level of the considered proportion and that auto-correlation also has a substantial impact on the chart. The investigation in this post were done in order to provide the user of such charts with a guidance on how to choose \(k\). Altogether, a full scientific analysis would need a more comprehensive simulation study and likely access to the real data, but the point of this post was to substantiate that statistical problems need a statistical investigation. From the simulation results in this post it appears more prudent to use \(k>2\), e.g., the upper limit of a 97.5% one-sided prediction interval would be \(k\)=2.22 or \(k\)=3.07 for the upper limit of a 99.5% one-sided prediction interval. Choosing \(k>2\) is also supported by the fact that none of the 204 signals generated by the system were interpreted as an outbreak. A simple fix to avoid confusion could be chop the upper threshold at 100% in the graphics, i.e. to report \(U_t^* = \max(1, U_t)\) for the Gaussian based procedures. Better would be to use the predictive approach and let the user choose \(\alpha\) and thus give the parameter choice a probabilistic interpretation. However, binomial and beta-binomial based approaches provide more stable results over the full range of \(\pi\) and are guaranteed to respect the \([0,1]\) support. In particular the non-parametric method looks promising despite being even simpler than the proposed k-sd-system. All in all, addressing trends or other type of auto-correlation as well as previous outbreaks in the baseline appears to be important in order to get a more specific syndromic surveillance system – see Sect. 3.4 of Salmon, Schumacher, and Höhle (2016) for how this could look. I invite you to read the Sarma et al. (2018) paper to form your own impressions. AcknowledgmentsThe contents of this post were discussed as part of the Statistical Consultancy M.Sc. course at the Department of Mathematics, Stockholm University. I thank Jan-Olov Persson, Rolf Sundberg and the students of the course for their comments, remarks and questions. Conflicts of InterestI have previously worked for the Robert Koch Institute. Some of the co-authors of the Sarma et al. (2018) paper are previous colleagues, which I have published together with. LiteratureArts, G. R. J., F. P. A. Coolen, and P. van der Laan. 2004. "Nonparametric Predictive Inference in Statistical Process Control." Quality Technology & Quantitative Management 1 (2): 201–16. Farrington, C.P, N.J. Andrews, A.D. Beale, and M.A. Catchpole. 1996. "A Statistical Algorithm for the Early Detection of Outbreaks of Infectious Disease." Journal of the Royal Statistical Society, Series A 159: 547–63. Fricker, R. D., B. L. Hegler, and D. A. Dunfee. 2008. "Comparing syndromic surveillance detection methods: EARS' versus a CUSUM-based methodology." Stat Med 27 (17): 3407–29. Salmon, M., D. Schumacher, and M. Höhle. 2016. "Monitoring Count Time Series in R: Aberration Detection in Public Health Surveillance." Journal of Statistical Software 70 (10). doi:10.18637/jss.v070.i10. Sarma, N., A. Ullrich, H. Wilking, S. Ghozzi, A. K. Lindner, C. Weber, A. Holzer, A. Jansen, K. Stark, and S. Vygen-Bonnet. 2018. "Surveillance on speed: Being aware of infectious diseases in migrants mass accommodations – an easy and flexible toolkit for field application of syndromic surveillance, Germany, 2016 to 2017." Euro Surveill. 23 (40). Young, G. A., and R. L. Smith. 2005. Essentials of Statistical Inference. Cambridge University Press.
To leave a comment for the author, please follow the link and comment on their blog: Theory meets practice.... R-bloggers.com offers daily e-mail updates about R news and tutorials on topics such as: Data science, Big Data, R jobs, visualization (ggplot2, Boxplots, maps, animation), programming (RStudio, Sweave, LaTeX, SQL, Eclipse, git, hadoop, Web Scraping) statistics (regression, PCA, time series, trading) and more... This posting includes an audio/video/photo media file: Download Now |
 represent our test statistic. For bootstrap hypothesis testing, we will construct
  test statistics from data generated using our sample. Call these test statistics
  . These statistics are generated in such a way that we know that the null hypothesis holds for them. Suppose for the sake of demonstration that large values of
  -value for the bootstrap hypothesis test is
 is the
  . There's the
  . Add this mean to each generated dataset and compute the
  statistic for each of those datasets; these will be the simulated test statistics
  represents a distribution that is known except maybe for the values of its parameters. Assume that
  is an independently and identically distributed dataset, and we have observed values
  . We wish to use the dataset to decide between the hypotheses


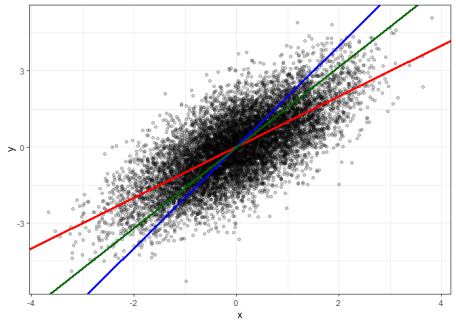


| You are subscribed to email updates from R-bloggers. To stop receiving these emails, you may unsubscribe now. | Email delivery powered by Google |
| Google, 1600 Amphitheatre Parkway, Mountain View, CA 94043, United States | |
Hi
ReplyDeleteSuch an amazing article.
It's interesting to read more about how AI can be used in the Healthcare industry.
You would love to see my python course duration and fees in pune site as well.
Thanks once again.